The Case of the Leaky Pool
4 December 2012
It always has to happen right before your system administrator leaves on vacation. The game is set, the stakes are high, and nobody is willing to fold. It was at a time like this that the Java Virtual Machine (JVM) on our second production server was discovered to be leaking memory like a gangster leaking blood in the Valentine’s Day Massacre. Unlike the mafiosos in Chicago, we couldn’t figure out why our JVM was bleeding.
Note that this post is best read in a 1920’s-style detective voice. I tried to have fun with the writing style, so just give it a go, OK? You might want to go re-read that first paragraph again, 314, just for practice. Additionally, some of the technical information might be slightly off-base (though I’m pretty certain that it’s not too far from the truth;) if you know better, please consider doing me a favor and letting me know in the comments section! I’d love the correction!
Like any good beat, we got two production servers with a fat load balancer in front. app01.prod is usually the point man, with app02.prod ready to take the heat if app01.prod gets iced. The cool kids call it a “hot failover,” but me? I just call it smart.
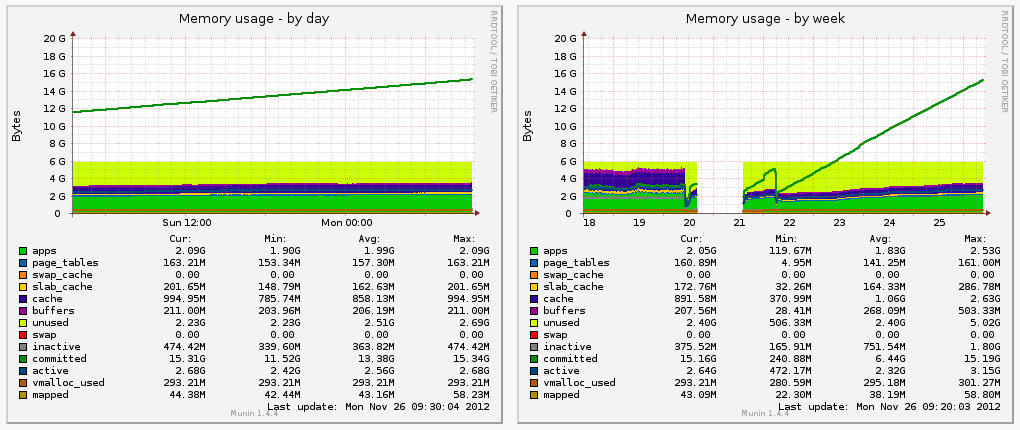
And being smart paid off. On Monday we looked at our Munin graphs to check in on the situation. The admin likes to do that before he checks out. Whether for peace of mind, or through grizzled experience doesn’t matter as much. Our monitoring reported all systems normal - except app02.prod.
Unlike most smart shops, we were running a different setup. app01.prod was running our code using Apache Passenger and MRI Ruby 1.8.7. It was the first gig we could get in the club of the corporate private cloud. The bouncer wouldn’t let any cool toys inside the party, so we had to dance to the music they played.
But that was a year and a half ago, and the bouncer changed his mind. And we got good at smuggling.
We were running into teething issues with MRI 1.8.7. MRI/YARV 1.9.3 has been roaming the streets for a while now, and we’re not sure we want to be stuck on yesterday’s ride. With MRI/YARV 2.0 just around the corner, it made sense to make a push for a better stack. So for the past four months we’ve been in the garage trying to refit the old car for a new trick: JRuby.
Particularly handy is the JRuby way of deploying to J2EE servers, which we can push into the private cloud like we own the joint. The whole organization is chill with anything Java, so we’re golden, right? Just grab a server, stand it up, and we’re in to the hottest cloud in town. A quick snoop around the scene shows a few promising candidates. I could deploy through GlassFish and cut WAR files using Warbler. I like GlassFish. I used it before at an old job. We go way back, GlassFish and I.
Or I could try this new kid on the block. It supports clustering, queues, and scheduled tasks. Long-running requests (for WebSockets and such) are included. I wryly thought back to a few dirty hacks I had running with delayed_job. Yeah, this TorqueBox kid is the right tool for the job. I tossed out the hacks and spruced up the app, and faster than you could say “UTF-8” it worked.
The sysadmin packaged up TorqueBox into a Debian package so we could install it in our private cloud on our production servers. Because of some legacy decisions in our build servers we had to take the whole .tar.gz file and rename it .png, then un-tar that in a post-install script. Yeah, we got good at smuggling. But it beat the bouncers, and we had our best tools inside the club for the first time.
But it’s not all roses when you’re trying to deploy something as complex as this. You look at a cron-style task schedule the wrong way and you can find yourself in a world of pain. Like I did this past week.
The leak was huge. We weren’t really sure how it could leak 18GB of memory on a 6GB dime, but it had. And the sysadmin was on his way out the door. In order to keep our production systems reliable he tore down app02.prod, which was running our experimental TorqueBox server, and restored it to running the same Apache/Passenger MRI 1.8.7 gig that app01.prod is running. If app01.prod gets iced, app02.prod will be at least as good as it was. And ain’t nobody wanted to think about what would happen if they both went down in a hail of requests. There are some things too horrifying to plan for.
This put my investigation in a pickle. The memory leak was only manifesting on app02.prod, and without the extant bug, it was my job to try and replicate it. I started spinning up VirtualBox VMs and tried to start replicating the bug in an environment as close to prod as was possible. But again, the sysadmin saved me.
He installed Munin on a little-known dame sitting in the other aisle, app01.stage, where we try out our new kicks before promoting them to a full prod showing.
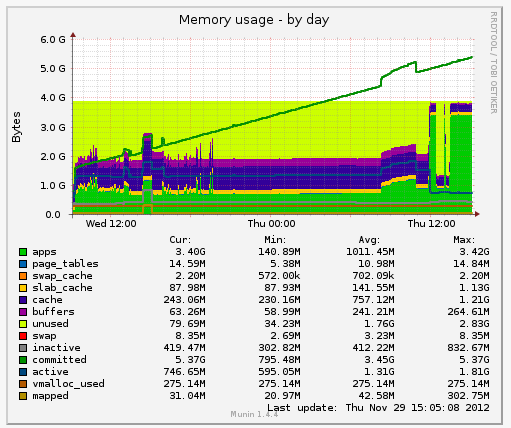
Stage was showing the same kind of problem as prod: an 18GB memory leak. app01.stage had been booted around the same time we last rebooted app02.prod, so the similar velocity in leak proved that we had the same dirt bag in our sights. The sysadmin left for the week, leaving me with app01.stage and a bug to find.
I spun down my VMs and SSH’d into app01.stage to take a look. I didn’t think I’d find anything, but it was worth a try. The system was stable, and it seemed to think that the culprit JVM was only taking 800MB of memory.
A clue!
I looked at the graph again. Munin says it was taking well beyond the memory space, yet there wasn’t any swap activity. Years of tracking down bugs hadn’t prepared me for this. But a crash-course in memory mapping I’d taken when experimenting with libdispatch’s I/O facilities had prepared me for this. Funny how the gigs you take for fun end up saving you in the end!
What I learned from libdispatch is that all programs are incurably greedy.
They allocate a city of memory, but only ever use a few blocks. Maybe they just keep the rest for a rainy day? Back in the old days of DOS and tommy guns this wasn’t a concern. You only ever ran a program at a time, and so nobody cared that the racketeers were running away with the city hall. There was one capo and he set The Rules. Life was simpler back then.
But the world got bigger, and more gangs started vying for the limelight. And they all wanted the same city - all of it. So we give it to them. All of it. And things got more complex.
When a program allocates memory, it runs through a call to either malloc or calloc, and a few others. But those are the big two. malloc returns unformatted memory, while calloc fills the memory with zeroes. malloc and calloc themselves chains down through the local runtime memory manager to see if it has free memory in a held page.
Memory is cordoned off into pages, like the blocks of a city. Unlike a city block, only one program can own a single page at a time - we can’t split ‘em up. So the local runtime has a small memory manager which will try and give you parts of existing pages it holds when you need more memory. If you have a 4KB page, and you have used 1KB of it, and you ask for 2KB of memory, it should give you part of that existing page. There are tools like guard malloc which change this slightly, but for everyone else this is the way it works.
If the local memory manager doesn’t have the memory, it hits the operating system kernel.
Now, kernels are smart. They know that programs are greedy, and so they cheat them. When the program malloc’s a fat load of memory, the kernel just pretends to give it what it wants. But in reality it just gives it pages of memory. Address space. Imaginary property. A deed with no land. Smoke and mirrors. A mirage. It even does this for calloc.
In Linux and Darwin (a FreeBSD fork), the kernel allocates a page of all-zero memory. Whenever a made man demands a leveled (zero-filled) block, the kernel gives him one, but it just forwards to that pre-made zero page. The mafioso can go look at the page and read it all. Everything’s zeroes. And that page is shared between potentially hundreds of gangsters at a time. It’s a city of addresses which all go to the same vacant lot. It’s deception on a grand scale!
The trick happens when they try to build a safe house on that block. The moment that they try to write to that zero-filled page, the kernel gets wise and creates a zero-filled page, then hands that right over to the program. Because of CPU-level magic, the address doesn’t change - everything is still distinct. If a page size is 4KB (which is typical), and a program asks for 2040KB of zero-filled pages, that program will get 510 pages which all map back to a single zero-filled page.
The program has 2040KB of address space allocated, but is only taking 0KB of physical memory.
The kernel beat the system, and over-sold the city.
When that program tries to write to that first page, the kernel fixes the situation and hands the program a real page, so now the program has 509 references to the shared page and one reference to a real, private page. It’s a slick trick called “Copy on Write.”
Now, the linearly increasing line on the Munin graph is showing the committed memory, which is address space given to programs, but which may or may not actually be used. That the real memory graph down below is incredibly low suggests that the program, in this case the JVM, is allocating lots of memory, but never touching it. Because of the fancy footwork on part of the kernel, this prevented the program from crashing due to a memory shortage.
Believe it or not, this narrows down the culprit significantly. But it requires some savvy with the JVM itself.
The JVM, as a virtual machine, allocates a heap space, usually something fairly large, like 64MB. It also enforces a heap space ceiling, usually at 256MB. In my server’s case, the JVM started with 64MB and had a ceiling of 512MB. But it also has a “permanent generation” space, which in this case was 256MB. This is where class definitions live, and other such things.
Anything Java, and by extension JRuby, is going to live in the Java heap space. Because of how the heap works, it won’t be living in mapped pages, so it should always be in physical RAM. To prove this, I used a tool called VisualVM to get a bug in their court. I watched the gang, and they never knew any better.
At first I installed VisualVM on my iMac, and then enabled the remote JMX connector on app01.stage. But then the corporate firewall blocked everything. A few experiments with SSH port forwarding similarly failed. I needed a way in, or I couldn’t see if I was right.
So I cheated. I ran wget on app01.stage to put VisualVM on the staging server, which is running headless. Then I ran SSH with X11 forwarding to put that window onto my local X server (XQuartz for Mac).
ssh -X app01.stage /root/visualvm/bin/visualvm
I had a way in. And it didn’t look bad. These mafia types are much nicer than the drug runners from LA.
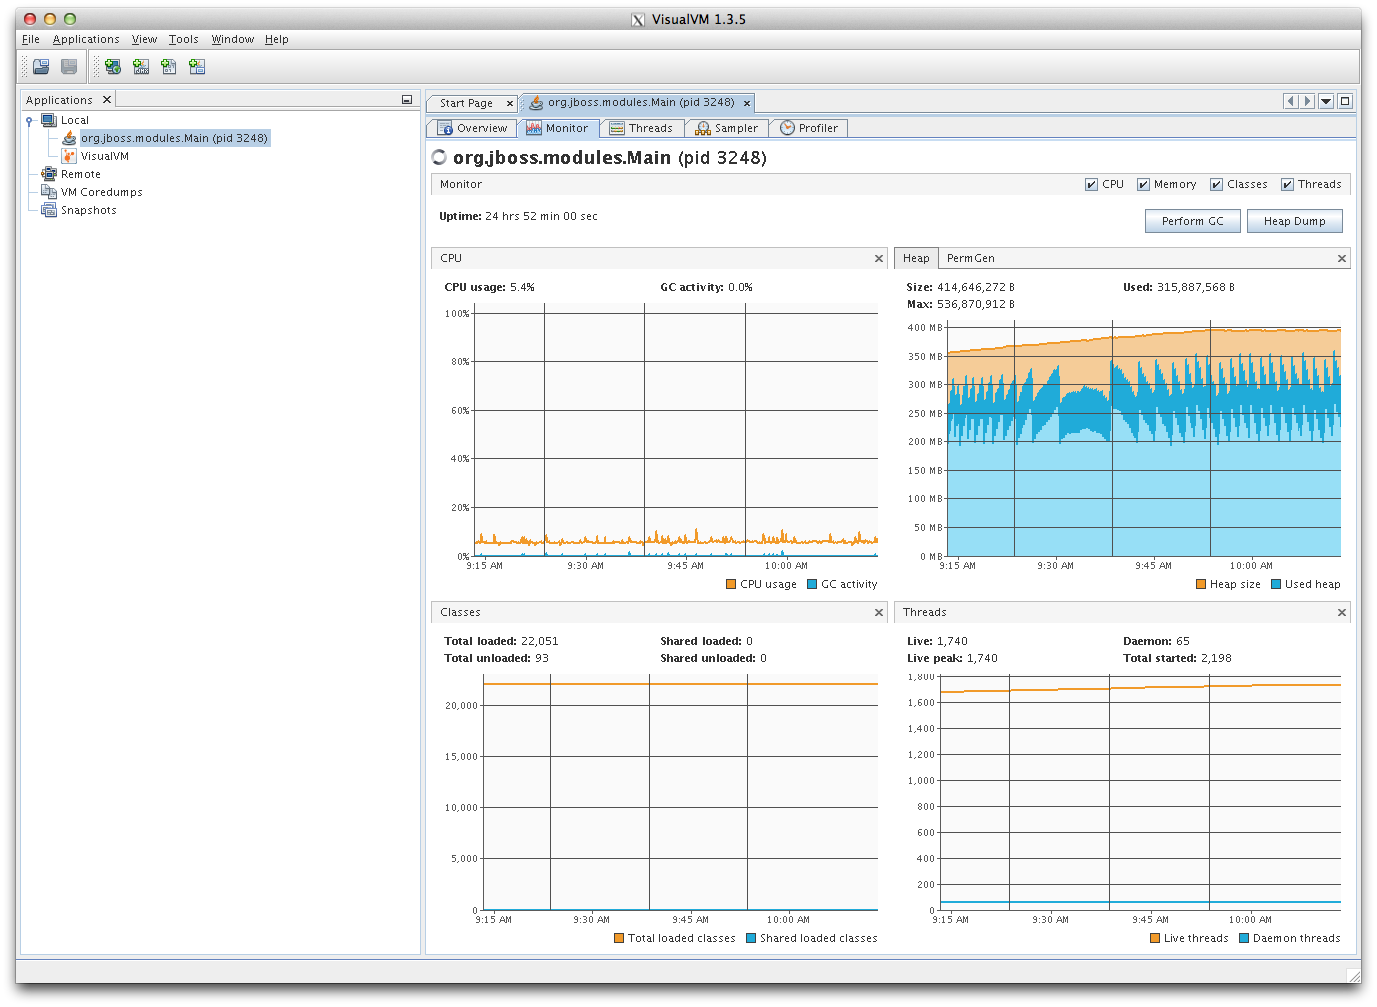
The heap space is normal. So it’s something causing a memory allocation that’s going deeper in the JVM.
Another clue.
This narrows down the list of suspects a lot. Nothing pure-Java or pure-JRuby will be doing this. It has to be a native call. Something is leaking inside the JVM itself.
I called in my friends. TorqueBox and JRuby have friendly, helpful communities. I hopped on IRC, my favorite diner, freenode.net, and poked the folks in #torquebox and #jruby. They confirmed my suspicions throughout. I’m on the right track.
After an APB to Google, I found a tool called pmap, which shows all allocated memory space for a process. Given that I was profiling a JVM with a full enterprise stack, running in a clustered High-Availability mode, there was a lot of stuff. I saw the Java heap space, the permanent generation space, as well as a few memory-mapped files.
The kernel is tricky again. When you read a file into memory, it will pretend to do so. Using the same ideas behind copy-on-write, it will expose the whole file’s length to your address space, but will swap out the actual memory. This partial in-memory caching can save big on space without impacting performance too much. pmap shows you files mapped to memory, which really helps to figure out what memory is doing what. Throw away all the files and you’re left with potentials for leaks.
But most interesting to me were hundreds of 2040KB “anonymous” pages. An anonymous page isn’t mapped to a specific file or network stream. It’s memory the program has allocated because the program needs memory. The Java heap space was a huge 300MB anonymous memory block. The permanent generation space was a similarly large 250MB anonymous memory block.
But what are these 2040KB blocks? And they were all exactly 2040KB.
By piping pmap into grep, I started counting them:
pmap 3248 | grep -c "2040K\\ rwx--\\ \\ \\ \\ \\[\\ anon\\ \\]"
I would run that, wait a little while, then run it again. I was getting another 2040KB allocation every minute. Then I noticed the VisualVM window behind that. I noticed the VM thread count.
1,740 threads sounds a little high, and it’s climbing. I know it’s an enterprise application server, but 1,740 is gratuitous. And I have 1,741 2040KB pages.
And the default stack size for a thread is 2040KB. After a few more minutes of watching, I’m sure. There’s a huge thread leak. Something is creating threads and never destroying them when it’s done.
VisualVM has a thread tab, which shows pure chaos: among the normal threads are around 1,550 threads, all helpfully named things like pool-1350-thread-1.
Another clue.
It’s not just leaking threads, it’s leaking thread pools with just one thread in them. That narrows it down a lot. Lots of code creates threads, but less code creates thread pools.
At this point I’m sure as Machine Gun Kelly’s spit that it’s thread leaks. A thread allocates a stack which lives outside the heap space, which fits the M.O. of the leak perfectly. My TorqueBox and JRuby associates on IRC heartily agreed.
My application doesn’t perform any manual threading, so it’s all going to be something from a underlying framework. The list of possibilities was nauseatingly endless, however:
oauth, which shouldn’t be spawning thread pools every minute. But it’s possible. It has to whack an external server and check back, so it could be using a thread.jdbc-mysql, which could very well be naughty with threads. I wasn’t too sure though. This one’s been through a lot, and he doesn’t seem like the type to simply throw caution to the wind and start doing illegal things.torquebox, which gets me crazy fun distributed caching and session stores, as well as exposes a logger which chains down to the JBoss AS 7 logger.torquebox-messaging, used to enqueue a delayed job.
The hunt went on. I started commenting out code and disabling parts of my app to try and shake out the leak, which helpfully reproduced on my iMac without complaint. But the app was too big, too complex to start tearing out suspects. I needed another in.
So I started a new, blank Rails app. I started a TorqueBox server, installed the app, and watched the thread count. The leak wasn’t there - good.
I added a few render-able pages, and checked the session for a user id (to verify that it wasn’t happening somewhere in the Infinispan cache). Still no leak.
I added a scheduled task. I had a scheduled task to run every 15 minutes and another to run every hour on my production app, so I was sure that it wasn’t in Quartz, the system which dispatches the scheduled tasks. Still no leak.
Then I added something innocent. I added a timeout. TorqueBox, via Quartz, will enforce a timeout on your tasks, notifying them when they should stop running. And sure enough, that timeout spawned a thread pool with a single thread to effect that notification, but there was no code to clean up that thread when it finished.
I looked at my production application. I had made a mistake. My hourly task was firing every minute, hence the leaked thread pool every minute. If I had caught that mistake I might have suspected the scheduled task earlier, and thereby caught the bug faster. Or I could have fixed it and never seen the bug again because one hour is far too intermittent to try and track down a single thread leak. My timeout was correctly set at 59 minutes, but even so, after that 59 minutes the timeout should have fired and cleaned itself up.
However, the important thing is that I caught the leaker red-handed. I had the whole police department surrounding the building, so I sent in a SWAT team to rustle out the no-good. I sent in one of the TorqueBox lead developers, Benjamin Browning. (Or rather he decided to help fix this of his own volition, but just work with the writing style a bit, please). He raced through the TorqueBox (and JBoss Polyglot) code base and discovered the culprit.
And Benjamin Browning, being the awesome person he is, fixed it. People using TorqueBox 2.2.0 will never have to worry about their scheduled tasks leaking timeout threads.
As I sat at my desk in the middle of the bullpen that afternoon I leaned back in my old chair and grinned. I was a heck of a chase, but in the end, I found the bad guy, and we brought him to justice.
There were a few other steps I didn’t mention, such as a cryptic spawn-stack trace I saw using a trial version of YourKit analyzer. This is also my first attempt at writing like a pulp-fiction crime novel. I hope you enjoyed it, 314!